最近后端服务在查询一张时序表时,莫名出现了断崖式的性能表现下降现象。出于对问题根本原因的探求,作者深入学习了 PostgreSQL 的规划器与执行器,以及 TimescaleDB 约束排除机制如何优化查询性能。总结原因并形成本文进行分享。
现象
作者对问题现象进行了抽象与简化,隐去了项目敏感信息
有时序表 metrics_history
CREATE TABLE metrics_history (
	pid int4 NOT NULL,
	aligntime timestamptz NOT NULL,
	value_1 float,
	value_2 float,
  ...
  value_100 float
);

CREATE INDEX idx_metrics_history ON metrics_history (aligntime DESC);

SELECT create_hypertable('metrics_history', 'aligntime');
并存储有 20 年的历史数据。
INSERT INTO metrics_history (pid, aligntime, value_1) VALUES
(1, generate_series('2000-01-01 00:00:00'::timestamptz, '2024-01-01 00:00:00'::timestamptz, '7 days'), 233);
执行下列两种 SQL ,两者的查询性能产生了明显的差异:
select * from metrics_history where aligntime >= '2023-12-01 00:00:00'::timestamp;
# SQL A 耗时 1000 ms 左右

select * from metrics_history where aligntime >= '2023-12-01 00:00:00'::timestamptz;
# SQL B 耗时 5 ms 左右
现场的代码使用了 SQL A 。
分析
不同阶段的约束排除
首先查看两套 SQL (分别记为 A-timestamp, B-timetamptz)的执行计划,出乎意料地大量时间耗费在生成执行计划阶段。
explain analyze select * from metrics_history where aligntime >= '2023-12-01 00:00:00'::timestamp;
                                                                              QUERY PLAN
-----------------------------------------------------------------------------------------------------------------------------------------------------------------------
 Custom Scan (ChunkAppend) on metrics_history  (cost=0.15..24627.71 rows=530019 width=36) (actual time=0.059..0.217 rows=5 loops=1)
   Chunks excluded during startup: 1248
   ->  Index Scan using _hyper_2_1251_chunk_idx_metrics_history on _hyper_2_1251_chunk  (cost=0.15..19.66 rows=423 width=36) (actual time=0.058..0.059 rows=1 loops=1)
         Index Cond: (aligntime >= '2023-12-01 00:00:00'::timestamp without time zone)
   ->  Index Scan using _hyper_2_1252_chunk_idx_metrics_history on _hyper_2_1252_chunk  (cost=0.15..19.66 rows=423 width=36) (actual time=0.034..0.034 rows=1 loops=1)
         Index Cond: (aligntime >= '2023-12-01 00:00:00'::timestamp without time zone)
   ->  Index Scan using _hyper_2_1253_chunk_idx_metrics_history on _hyper_2_1253_chunk  (cost=0.15..19.66 rows=423 width=36) (actual time=0.054..0.054 rows=1 loops=1)
         Index Cond: (aligntime >= '2023-12-01 00:00:00'::timestamp without time zone)
   ->  Index Scan using _hyper_2_1254_chunk_idx_metrics_history on _hyper_2_1254_chunk  (cost=0.15..19.66 rows=423 width=36) (actual time=0.031..0.031 rows=1 loops=1)
         Index Cond: (aligntime >= '2023-12-01 00:00:00'::timestamp without time zone)
   ->  Index Scan using _hyper_2_1255_chunk_idx_metrics_history on _hyper_2_1255_chunk  (cost=0.15..19.66 rows=423 width=36) (actual time=0.034..0.034 rows=1 loops=1)
         Index Cond: (aligntime >= '2023-12-01 00:00:00'::timestamp without time zone)
 Planning Time: 1280.452 ms
 Execution Time: 10.522 ms
explain analyze select * from metrics_history where aligntime >= '2023-12-01 00:00:00'::timestamptz;
                                                                              QUERY PLAN
-----------------------------------------------------------------------------------------------------------------------------------------------------------------------
 Append  (cost=0.15..108.85 rows=2115 width=36) (actual time=0.029..0.123 rows=5 loops=1)
   ->  Index Scan using _hyper_2_1251_chunk_idx_metrics_history on _hyper_2_1251_chunk  (cost=0.15..19.66 rows=423 width=36) (actual time=0.029..0.029 rows=1 loops=1)
         Index Cond: (aligntime >= '2023-12-01 00:00:00+00'::timestamp with time zone)
   ->  Index Scan using _hyper_2_1252_chunk_idx_metrics_history on _hyper_2_1252_chunk  (cost=0.15..19.66 rows=423 width=36) (actual time=0.027..0.027 rows=1 loops=1)
         Index Cond: (aligntime >= '2023-12-01 00:00:00+00'::timestamp with time zone)
   ->  Index Scan using _hyper_2_1253_chunk_idx_metrics_history on _hyper_2_1253_chunk  (cost=0.15..19.66 rows=423 width=36) (actual time=0.020..0.020 rows=1 loops=1)
         Index Cond: (aligntime >= '2023-12-01 00:00:00+00'::timestamp with time zone)
   ->  Index Scan using _hyper_2_1254_chunk_idx_metrics_history on _hyper_2_1254_chunk  (cost=0.15..19.66 rows=423 width=36) (actual time=0.021..0.021 rows=1 loops=1)
         Index Cond: (aligntime >= '2023-12-01 00:00:00+00'::timestamp with time zone)
   ->  Index Scan using _hyper_2_1255_chunk_idx_metrics_history on _hyper_2_1255_chunk  (cost=0.15..19.66 rows=423 width=36) (actual time=0.024..0.024 rows=1 loops=1)
         Index Cond: (aligntime >= '2023-12-01 00:00:00+00'::timestamp with time zone)
 Planning Time: 7.297 ms
 Execution Time: 0.182 ms
通过对执行计划的解读以及 TimescaleDB 官方对自定义扫描节点(ChunkAppend)的说明:
- SQL A 在计划阶段,决定对 metrics_history 的 1253 个块(Chunks)执行索引扫描。直到执行器启动阶段,才通过约束排除忽略了 1248 个块,最终对 5 个块实际执行了索引扫描,并做结果合并。
- SQL B 在计划阶段,直接利用约束排除特性,决定仅需对 metrics_history 的 5 个块执行索引扫描。最终实际对 5 个块执行了索引扫描并合并获得结果。
总的来说,aligntime ≥ ‘2023-12-01 00:00:00’::timestamp 使得约束排除后置到了执行器启动阶段;而 aligntime ≥ ‘2023-12-01 00:00:00’::timestamptz 使得约束排除在计划阶段就能产生作用,并极大地优化了计划耗时。毕竟对上千张表做执行计划并产出最经济的计划是有极高成本的。
易变性对约束排除的影响
至于为什么 timestamp 和 timestamptz 会对 SQL 的执行产生截然不同的影响。这就不得不提PostgreSQL 函数的易变性分类了。易变性是函数对优化器关于其自身行为的承诺:
- 不可变(Immutable)函数:
- 无法修改数据库数据
- 保证在给定相同参数的情况下永远返回相同的结果,可以在计划阶段安全地评估
- 例如 length()
- 稳定(Stable)函数:
- 无法修改数据库数据
- 保证在同一查询中给定相同参数时返回相同结果,可以在执行期间安全地进行评估
- 例如 now()
- 易失性(Volatile)函数:
- 可以修改数据库
- 能够在使用相同参数的连续调用中返回不同的结果
- 例如 random()
额外地,表达式在实际执行过程中,也被视为是函数的一种应用。
故不得不认为:
- aligntime ≥ ‘2023-12-01 00:00:00’::timestamp 运用的函数是稳定函数
- aligntime ≥ ‘2023-12-01 00:00:00’::timestamptz 则运用了不可变函数
如何验证这一观点?数据库的 postgresql.conf 配置文件中提供了选项 debug_print_parse, debug_print_rewritten, debug_print_plan (GUC-DEBUG-PRINT-PARSE),通过调整配置为开启,能够在日志中获得不同阶段的查询树数据结构。
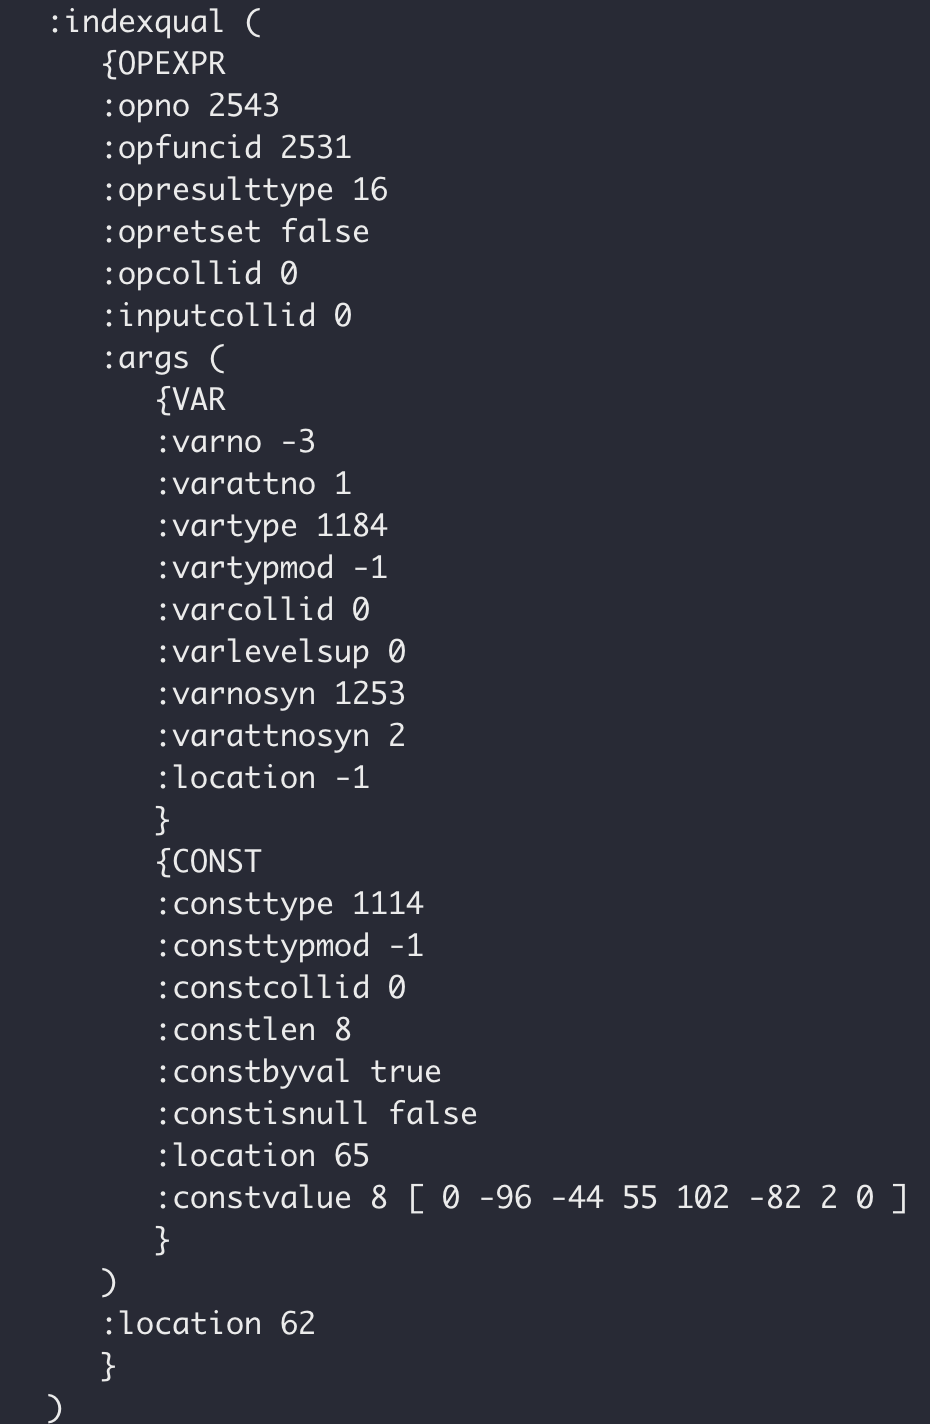
aligntime ≥ timestamp 使用函数 OID = 2531
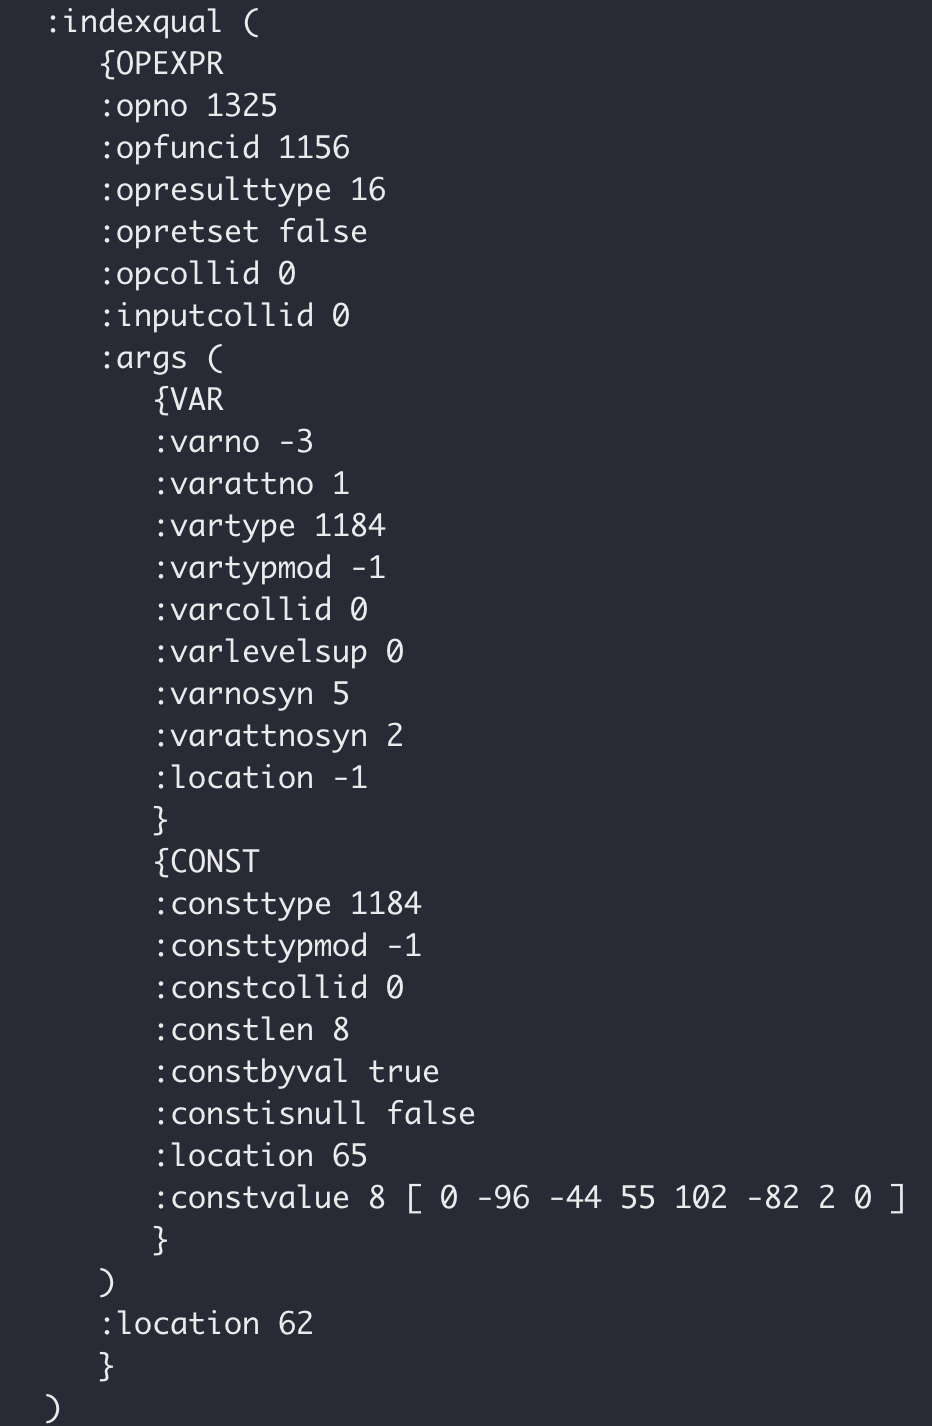
aligntime ≥ timestamptz 使用函数 OID = 1156
通过检查日志,aligntime ≥ ‘2023-12-01 00:00:00’::timestamp 使用了函数 OID = 2531,而 aligntime ≥ ‘2023-12-01 00:00:00’::timestamptz 使用了函数 OID = 1156。
select oid, proname, provolatile, proargtypes from pg_proc where oid IN (2531,1156);

oid |proname                 |provolatile|proargtypes|
----+------------------------+-----------+-----------+
1156|timestamptz_ge          |i          |1184 1184  |
2531|timestamptz_ge_timestamp|s          |1184 1114  |

select oid,typname from pg_type where oid in (1114, 1184);

oid |typname    |
----+-----------+
1114|timestamp  |
1184|timestamptz|
查表显示函数分别是 timestamptz_ge_timestamp 和 timestamptz_ge,对应的易变性类型分别是稳定和不可变。
这就对 SQL A, B 的执行计划及查询效率做出了充分且合理的解释。
至于为什么 timestamptz_ge_timestamp 被认为是稳定而非不可变函数,由于缺乏场景,暂时没有想到理由,也没有进一步考证。
扩展
另外对于参数化查询(PreparedStatement) SQL,相比较于直接的 SQL 查询又稍显复杂。 但其本质不会发生改变。
PREPARE fooplan0 (varchar) AS
	select * from metrics_history where aligntime >= $1::timestamp;

PREPARE fooplan1 (varchar) AS
	select * from metrics_history where aligntime >= $1::timestamptz;

PREPARE fooplan2 (timestamp) AS
	select * from metrics_history where aligntime >= $1::timestamp;

PREPARE fooplan3 (timestamp) AS
	select * from metrics_history where aligntime >= $1::timestamptz;

PREPARE fooplan4 (timestamptz) AS
	select * from metrics_history where aligntime >= $1::timestamp;

PREPARE fooplan5 (timestamptz) AS
	select * from metrics_history where aligntime >= $1::timestamptz;

PREPARE fooplan6 (timestamptz) AS
	select * from metrics_history where aligntime >= $1;

PREPARE fooplan7 (timestamp) AS
	select * from metrics_history where aligntime >= $1;
这几个参数化查询 SQL 只有 fooplan5、fooplan6 能够以较快效率执行,而其他的表现与 SQL A 表现一致。其根本原因,也都是因为 SQL 执行计划中使用了稳定函数,无法在计划阶段实现约束排除。
结论
总结整个分析与扩展过程,函数易变性会影响 SQL 的计划耗时与执行耗时。而现场故障发生阶段并不涉及对 SQL 的变更,从因果上分析,计划阶段的块(Chunks)可能发生了异常增长。结合现场实际的排查,也确认是由于过去 20 年历史数据的导入,分块由 200 突增到 1200 多,导致计划耗时暴增。
通过移除非必要的历史数据缩减分块,以及优化 SQL 以尽早利用约束排除特性。业务整体性能表现恢复正常。